
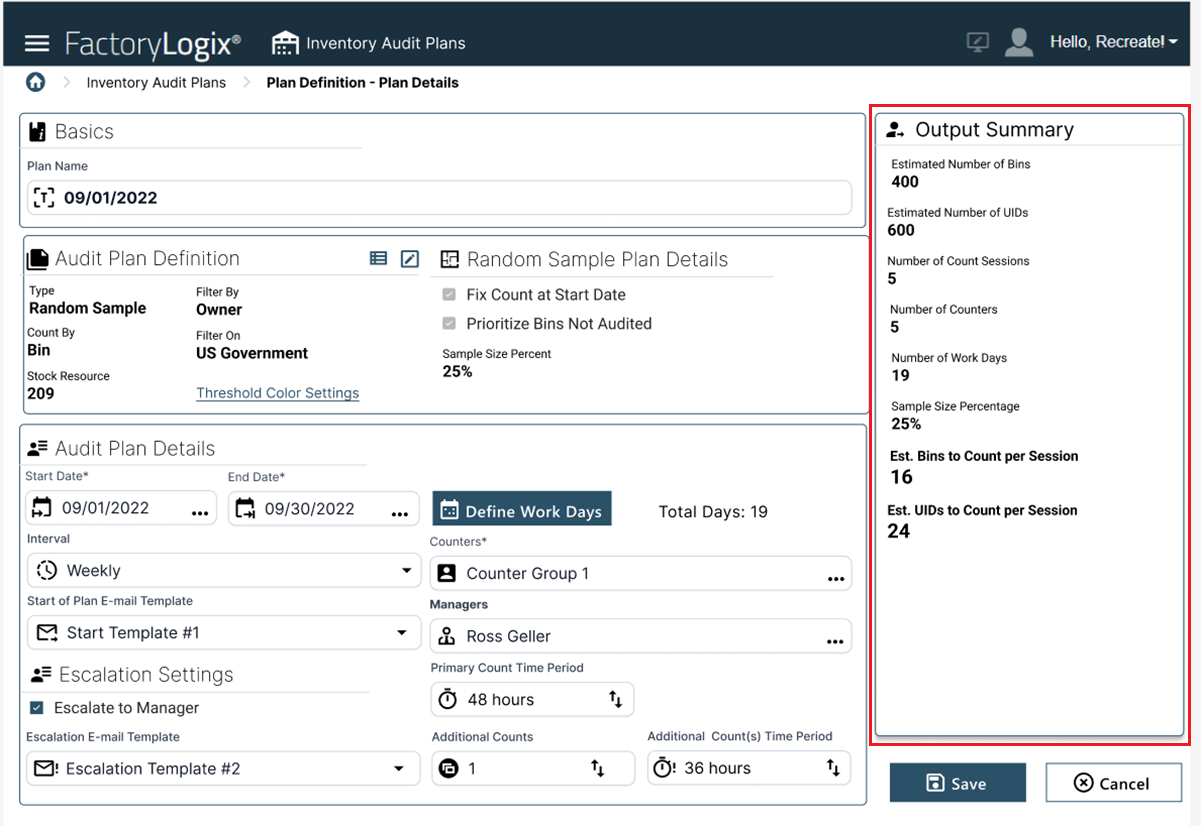
When the planner enters the Audit Plan Definition properties in the Audit Plan window, the Estimated Number of Part Numbers and/or Estimated Number of Bins and Estimated Number of UIDs will be populated with the number of records in inventory representing each. The recorded estimated numbers are manipulated by calculations using these properties, which in turn provides the final output of data for the Estimated Bins to Count Per Session and/or Estimated Bins to Count Per Session and Estimated UIDs to Count Per Session.
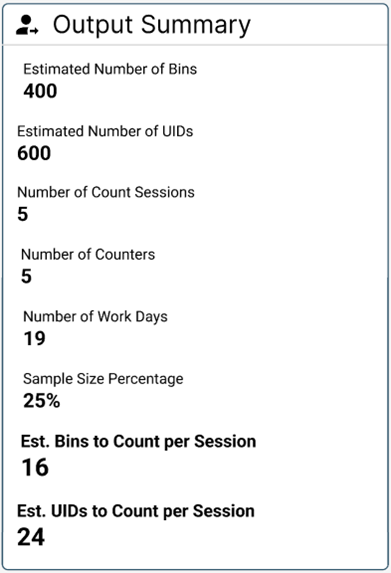
Inputs and calculations used for the Output Summary view
The following table describes the data you see in the Output Summary in the Audit Plan window.
|
Item |
Description |
|---|---|
|
Total Estimated Number of Bins |
The records representing the storage locations retrieved from the current inventory recorded in the system as a result of the filters defined in the audit plan definition. |
|
Total Estimated Number of Part Numbers |
The records representing the part numbers retrieved from the current inventory recorded in the system as a result of the filters defined in the audit plan definition. This value is only relevant when counting by part numbers. |
|
Estimated number of UIDs |
Filtered records representing the UIDs retrieved from the current inventory recorded in the system as a result of the filters defined in the audit plan definition. |
|
Sample Size Percentage |
This field is only populated when using the Random Sample audit plan type and is used to calculate the estimated number of Bins and Estimated Number of Parts |
|
Number of Count Session |
Determined from the start date to end date and the selected interval. |
|
Number of Counters |
Determined from the groups and/or users specified in the Counters field. |
|
Estimated Bins to Count Per Session |
This field is determined by: |
|
Estimated Part Numbers to Count Per Session |
This field is determined by: |
|
Estimated UIDs/Part Numbers to Count Per Session |
This field is determined by: |
Example
The following is a Random Sample audit plan example displaying output summary data:
Using the Bin Number:
25% of 1600 = 400
5 (# of counters) * 5 (Number of count sessions) = 25 total count sessions
400 / 25 = 16 bins per counter per week
Tip
An audit planner can use the Output Summary data to apply the correct resources, timing, and percentage which will be the most efficient and result in the least interference of regular work activities. (This type of forecasting can only be applied to Continuous and Random Sample scheduled audit plan types.)